NASDAQ Data Center (Carteret)
Carteret, USA · Established 2012
This site requires authorization to access.
To request access, contact
william.goetzmann@yale.edu
The physical home of the NASDAQ Stock Market’s matching engine is not a columned temple of finance but a windowless industrial facility at 1400 Federal Boulevard in Carteret, New Jersey—a nondescript data center indistinguishable from the warehouses and shipping terminals that surround it. Originally operated by CyrusOne and later acquired by Equinix (designated NY11), the facility provides approximately 113,000 square feet of raised-floor colocation space, supported by redundant power feeds and industrial-grade cooling systems capable of dissipating the enormous heat generated by thousands of densely packed servers. As Donald MacKenzie documented in “Material Signals: A Historical Sociology of High-Frequency Trading” (American Journal of Sociology, 2018), the physical architecture of such data centers is engineered with obsessive precision: network cables connecting colocated trading firms to the exchange’s matching engine are cut to equal lengths—regardless of each firm’s actual distance from the engine—so that no participant gains a latency advantage from physical proximity within the building. This practice of “equal-length cabling” transforms the interior geometry of the data center into a kind of engineered fairness, a deliberate flattening of space that recalls, in inverted form, the open outcry pits where physical proximity to the center once conferred advantage. The NASDAQ matching engine itself—the INET platform—traces its lineage to Joshua Levine’s Island ECN, founded in 1996, which merged with Instinet’s ECN in 2002 and was acquired by NASDAQ in December 2005 for $1.88 billion. As Scott Patterson recounted in Dark Pools: The Rise of the Machine Traders and the Rigging of the U.S. Stock Market (2012), Levine’s Island system was revolutionary in its simplicity: a pure electronic limit order book that matched buy and sell orders by price-time priority with no human intervention. NASDAQ adopted INET as its primary matching engine in 2006, and by the time operations migrated to Carteret around 2012, the system could process orders in microseconds. The Carteret facility thus represents the culmination of a physical migration that began with the Bunker Ramo Corporation’s data center in Trumbull, Connecticut, where NASDAQ first went live on February 8, 1971. From Trumbull, operations moved to facilities in Norwalk, Connecticut, before the latency imperatives of modern electronic trading drew NASDAQ to central New Jersey’s data center corridor. The contrast between the anonymous Carteret facility and NASDAQ’s public face—the MarketSite at 4 Times Square, with its seven-story cylindrical LED tower and broadcast studio—is itself an artifact of the electronic age: the place where the market actually operates is invisible, while the place where the market is performed for cameras is a spectacle. NASDAQ also maintains corporate offices at 1 Liberty Plaza in Lower Manhattan, but no trades are executed there. The Carteret data center, unremarkable to the eye, is the true locus of one of the world’s largest securities markets.
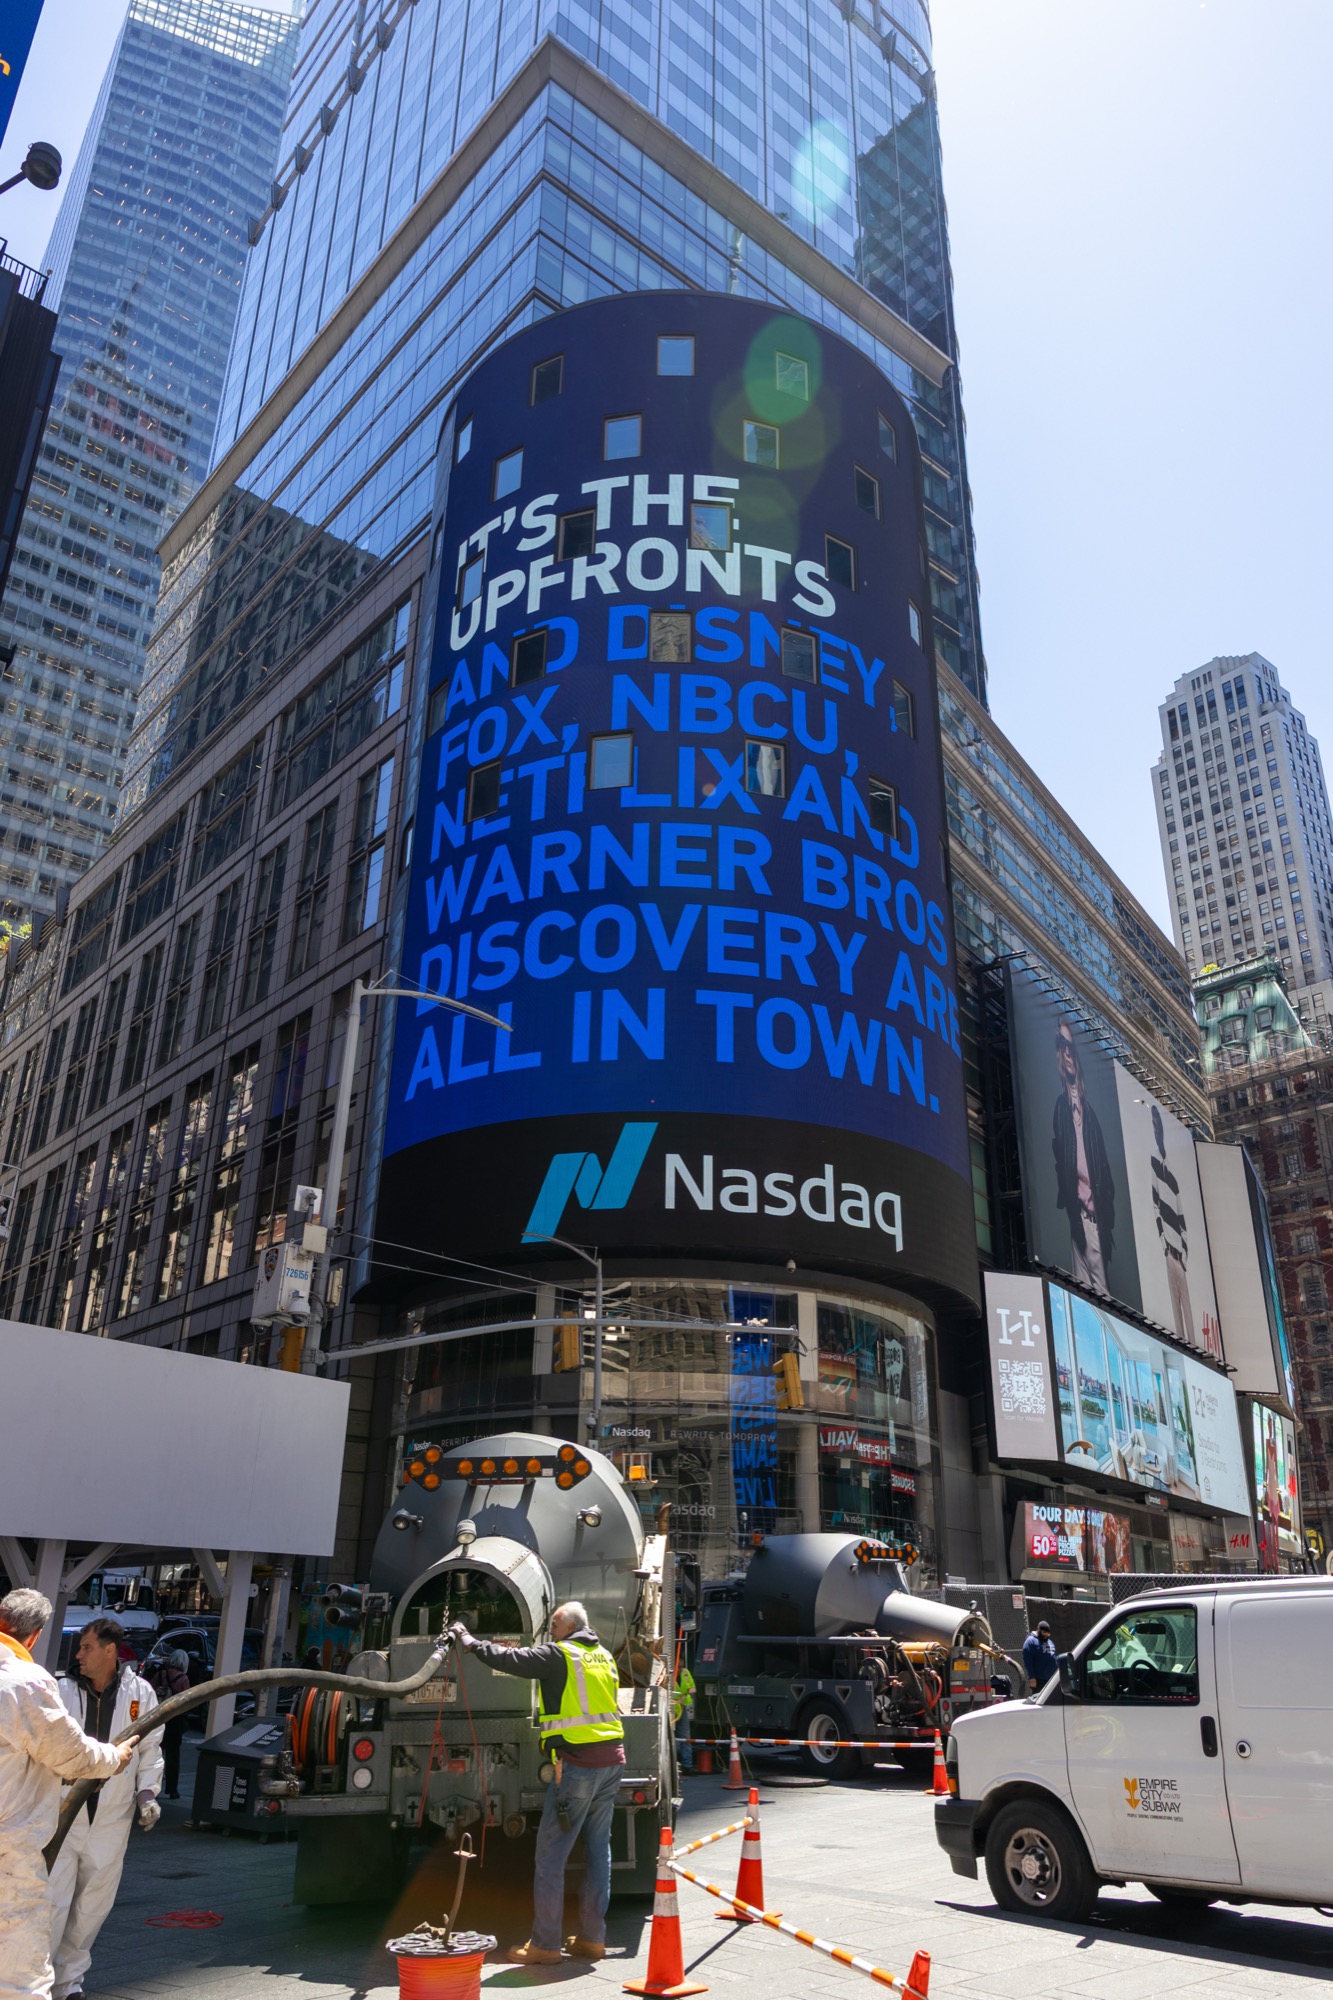
NASDAQ’s visual culture is among the most recognizable in global finance, yet it is entirely decoupled from any physical trading space—a paradox unique among major exchanges. The centerpiece of this visual identity is the NASDAQ MarketSite tower, an eight-story cylindrical glass structure embedded in the base of the Condé Nast Building at 4 Times Square (designed by Fox & Fowle Architects, completed 1999). The tower’s exterior is wrapped in a full-motion LED video display measuring approximately 120 feet in height and 84 feet in width—some 10,000 square feet of screen—that cost an estimated $37 million to install. Activated on December 28, 1999, at the zenith of the dot-com bubble, the MarketSite tower became one of the most photographed architectural surfaces in New York City, its cascading stock tickers and corporate advertisements visible from blocks away in the neon canyon of Times Square. The tower functions as a broadcast studio and ceremonial venue: NASDAQ’s opening and closing bell ceremonies—themselves an invention necessitated by the absence of a trading floor—are staged here before cameras and streamed globally via CNBC, Bloomberg Television, and Fox Business News. Corporate executives ring a ceremonial button (not an actual bell, though the sound is digitally reproduced) while standing before a curved video wall displaying their company’s logo and stock price. The deeper visual legacy of NASDAQ, however, lies in the interface innovations that transformed how markets are seen. In 1983, NASDAQ introduced Level II quotation data, which for the first time displayed multiple layers of bid and ask prices from competing market makers, revealing the “depth of book” that had previously been visible only to exchange insiders. As Juan Pablo Pardo-Guerra argued in Automating Finance: Infrastructures, Engineers, and the Making of Electronic Markets (Cambridge University Press, 2019), the electronic screen itself became the marketplace—a radical departure from the architectural spaces that had housed trading for centuries. The Level II screen, popularized among retail traders in the 1990s through platforms descended from Levine’s Island ECN and the SOES (Small Order Execution System) trading community, created an entirely new visual grammar of finance: scrolling green and red numbers, flashing bid-ask spreads, and the animated “order book” that became the lingua franca of electronic trading. NASDAQ’s brand identity—the distinctive cyan-green color palette, the clean sans-serif wordmark—reinforces this association with digital modernity. The market that NASDAQ represents exists only on screens; there is no physical space to photograph, no trading floor to visit. The MarketSite tower is, in this sense, a compensatory spectacle: a dazzling architectural surface that masks the absence of the architectural interior that every other major exchange possesses.
The NASDAQ matching engine’s location in Carteret, New Jersey—a small borough of approximately 24,000 people in Middlesex County, roughly twenty-five miles southwest of Manhattan—illustrates how the geography of modern financial markets has been reorganized around the physics of signal propagation rather than the logic of urban commerce. As Eric Budish, Peter Cramton, and John Shim demonstrated in “The High-Frequency Trading Arms Race: Frequent Batch Auctions as a Market Design Response” (Quarterly Journal of Economics, 2015), the value of being microseconds faster than a competitor in processing market data creates enormous economic incentives to minimize the physical distance—and therefore the signal latency—between trading venues. Carteret sits at the heart of what industry participants call the New Jersey data center corridor, a constellation of facilities stretching from Mahwah in the north (where the New York Stock Exchange’s matching engine operates at a facility roughly fifty miles from Carteret) to Secaucus in the northeast (home to CBOE’s and several other exchanges’ matching engines, approximately twenty miles away) and Weehawken to the east. NASDAQ’s migration from Connecticut to New Jersey was driven by this latency geography. When NASDAQ operated from Trumbull and later Norwalk, Connecticut, the physical distance to competing exchanges in the New York metropolitan area imposed a measurable speed disadvantage for cross-market trading strategies. As Michael Lewis documented in Flash Boys: A Wall Street Revolt (2014), firms spent hundreds of millions of dollars—including Spread Networks’ legendary $300 million fiber-optic cable from Chicago to New Jersey—to shave milliseconds from data transmission times. The relocation to Carteret placed NASDAQ within the low-latency fiber network that interconnects all major U.S. equity exchanges, dark pools, and alternative trading systems in northern New Jersey. The colocation ecosystem at the Carteret facility allows trading firms to place their own servers in the same building as the matching engine, reducing round-trip order execution times to microseconds. The resulting geography is profoundly ironic. NASDAQ was founded in 1971 as the world’s first “virtual” exchange—a network of terminals with no central trading floor—yet its contemporary operations are utterly dependent on physical proximity. The Regulation NMS framework adopted by the SEC in 2005 reinforced this dependence by establishing the National Best Bid and Offer (NBBO), which requires brokers to route orders to whichever exchange is displaying the best price at any given moment. The NBBO creates an invisible network linking the physically separate data centers in Mahwah, Carteret, Secaucus, and elsewhere into a single, integrated national market—but the speed at which price information travels between these nodes determines who can profit from fleeting price discrepancies. Carteret’s position in this network topology is not an accident of real estate but a calculated response to the physics of light in fiber-optic cable, traveling at roughly two-thirds the speed of light, or approximately 124 miles per millisecond.
The NASDAQ Stock Market commenced operations on February 8, 1971, when the National Association of Securities Dealers (NASD) activated an electronic quotation system built by the Bunker Ramo Corporation of Trumbull, Connecticut. The system displayed bid and ask prices for approximately 2,500 over-the-counter securities on terminals in broker-dealer offices across the country—the first time that a securities market existed entirely on screens rather than on a physical trading floor. Gordon Macklin, the NASD’s president and widely regarded as the “father of NASDAQ,” oversaw the system’s development and served as its first chief executive until 1987. In its inaugural year, the system facilitated trading of nearly two billion shares. The NASD purchased the Bunker Ramo equipment outright in 1976. The NASDAQ-100 Index was launched on January 31, 1985, tracking the one hundred largest non-financial companies listed on the exchange and establishing NASDAQ’s identity as the preeminent marketplace for technology and growth companies. This identity was spectacularly confirmed—and then shattered—by the dot-com bubble: the NASDAQ Composite Index rose from 751 in January 1995 to an intraday peak of 5,132 on March 10, 2000, before collapsing seventy-eight percent to 1,114 by October 2002. A pivotal episode in NASDAQ’s institutional history was the order-handling rules scandal of the mid-1990s. In a landmark study, William Christie and Paul Schultz published “Why Do NASDAQ Market Makers Avoid Odd-Eighth Quotes?” (Journal of Finance, 1994), demonstrating that market makers in seventy-one of one hundred actively traded NASDAQ securities virtually never quoted prices in odd eighths of a dollar, implicitly maintaining artificially wide bid-ask spreads of at least twenty-five cents. When newspapers reported the findings on May 26–27, 1994, dealers in major stocks such as Amgen, Cisco Systems, and Microsoft abruptly began quoting in odd eighths, and spreads fell by nearly fifty percent—behavior consistent with the sudden abandonment of a tacit collusive arrangement. The resulting regulatory fallout included a billion-dollar class-action settlement against thirty-three market-making firms, investigations by the SEC and the Department of Justice, and the SEC’s 1997 Order Handling Rules, which required market makers to display customer limit orders and ECN quotes on the NASDAQ ticker. NASDAQ’s transformation into a modern electronic exchange accelerated through a series of acquisitions and structural changes. In December 2005, NASDAQ completed the $1.88 billion acquisition of Instinet Group, gaining the INET electronic matching engine descended from Joshua Levine’s Island ECN. In November 2007, NASDAQ acquired the Philadelphia Stock Exchange (PHLX) for $652 million, adding one of the nation’s premier options trading platforms. The combination with OMX AB in February 2008, valued at $3.7 billion, created the NASDAQ OMX Group and extended the company’s reach to the Nordic and Baltic exchanges in Stockholm, Helsinki, Copenhagen, Reykjavík, Tallinn, Riga, and Vilnius. NASDAQ demutualized in 2000–2002, with shares beginning to trade under the ticker NDAQ, and was recognized as a registered national securities exchange by the SEC in January 2006. Two dramatic technological failures exposed the fragility of NASDAQ’s electronic infrastructure. On May 18, 2012, a design flaw in the IPO Cross system caused a cascading failure during the initial public offering of Facebook, leaving approximately 30,000 orders “stuck” in the system and delaying the start of trading by thirty minutes. NASDAQ paid a $10 million penalty to the SEC—the largest ever imposed on an exchange. On August 22, 2013, a connectivity failure between the Securities Information Processor (SIP) and NYSE Arca overwhelmed the system with over 26,000 quote updates per port per second, triggering a three-hour halt in all NASDAQ-listed trading—an event known as the “flash freeze.” These incidents underscored the systemic risks inherent in a market architecture where a single data center in Carteret, New Jersey, serves as the chokepoint for trillions of dollars in daily capital flows.
As of 2024, approximately 4,075 companies list securities on the NASDAQ Stock Market, distributed across three tiers: the NASDAQ Global Select Market, the NASDAQ Global Market, and the NASDAQ Capital Market. The exchange is overwhelmingly associated with the technology sector—its largest listings include Apple, Microsoft, Amazon, Alphabet, Meta Platforms, NVIDIA, and Tesla, the cohort sometimes called the “Magnificent Seven”—though it also lists companies in healthcare, consumer services, and industrials. The NASDAQ Composite Index, encompassing all domestically listed common stocks, and the NASDAQ-100 Index, tracking the hundred largest non-financial listings, are among the most widely followed equity benchmarks in the world. More than 150 exchange-traded products worldwide track indices in the NASDAQ-100 ecosystem, with over $520 billion in assets under management as of late 2024. The instruments traded on NASDAQ and the mechanisms of their execution have undergone a transformation as profound as any in the history of securities markets. When NASDAQ launched in 1971, it was not an exchange in the traditional sense but an electronic quotation system: market makers posted competing bid and ask prices on Bunker Ramo terminals, but actual trades were negotiated by telephone. This dealer-based model—in which market makers profited from the spread between their bid and ask quotes—persisted until the mid-1990s, when the Christie and Schultz scandal and the SEC’s resulting Order Handling Rules of 1997 forced fundamental structural changes. The new rules required market makers to display customer limit orders alongside their own quotes, effectively grafting an electronic limit order book onto what had been a pure dealer market. As Patterson documented in Dark Pools (2012), Joshua Levine’s Island ECN had already demonstrated the viability of a fully automated, anonymous limit order book—a system in which any participant could post a price and quantity, and the matching engine would execute trades automatically by price-time priority. When NASDAQ acquired Island’s successor, INET, in 2005 and adopted it as the exchange’s primary matching engine, the transformation from dealer market to electronic limit order book was complete. The Level II quotation display, introduced by NASDAQ in 1983, was itself a landmark innovation in market transparency. For the first time, traders could see not just the best bid and ask (Level I) but the full array of competing quotes at multiple price levels—the “depth of book” that reveals the supply and demand structure of the market. In the 1990s, Level II screens became the essential tool of the day-trading community, including the so-called “SOES bandits” who used NASDAQ’s Small Order Execution System (established in 1984 and made mandatory after the 1987 crash) to execute rapid trades against slower-moving market makers. NASDAQ also operates the NASDAQ Options Market (NOM) and, through its PHLX subsidiary, one of the largest equity options exchanges in the United States. Average daily trading volume across all NASDAQ venues exceeds 1.8 billion transactions. The exchange’s role in the growth of exchange-traded funds has been substantial: many of the most actively traded ETFs in the world, including the Invesco QQQ Trust tracking the NASDAQ-100, are listed on NASDAQ.
Images will be added as the project develops. Photographs by Larry Ng and from research sources.